
You can now get Shearwater Cloud Version 2.11.0 for download.
Release Notes for Shearwater Cloud Version 2.11.0 for Desktop and Mobile
(also available at the Google Play Store or the Apple App Store).
Highlights of the new release:
- Added Tern Support including 12 languages
- Chinese, English, French, German, Italian, Japanese, Korean, Polish, Portuguese, Russian, Spanish, Traditional Chinese
- New Graph Update:
- Analysis “Drag” Interaction option allows selection of a range of a dive, giving max, min, and averages for values
- Milestone display for Max Depth, and, for AI dives, 2/3 Pressure, ½ Pressure, and 1/3 Pressure
- Dive Comparison Options:
- Standard
- Sequential – display dives next to each other
- Range – display dives overlaid on each other
- Organized Data options into relevant headings
Shearwater Cloud Graph Guide
Viewing and analyzing dives can provide insights for divers looking to plan their next dive. This article aims to explain some of the newer features with the new graph released in Shearwater Cloud version 2.11.0.
Graph Overview
The Shearwater Cloud graph in version 2.11.0 has many new features.
To access the graph, select a dive and tap on the Graph panel. An interactive graph will be visible:

Shearwater Cloud Graph with a sample dive

Shearwater Cloud Graph with feature labels
In this image we can see labels identifying some of the key features of the graph:
- Axis
- Primary Axis, measuring the depth of the dive
- Dive Time Axis, measuring time elapsed since the start of the dive
- Contextual Secondary Axis, measuring the value of the last series hovered or tapped on
- Data Series:
- These are the graphed values by time of the dive.
- In this example, there are three series: Depth, Cylinder Pressure, and GF99, each with different colours
- Series can be turned on or off in the Data menu.
- Data Panel:
- To examine points on the graph, touching or hovering the mouse on an area of the graph will bring up the Data Panel, which will show values of active series.
- The position of the Data Panel can be changed in the Display menu.
- Depth and Gas Milestones
- This graph shows three milestones: 2/3 Tank Pressure, 1/3 Tank Pressure, and Max Depth.
- These can be turned on or off in the Analysis menu.
- Zoom Controls
- The three buttons: Reset, Zoom In, and Zoom Out, allow a closer look at areas of the graph.
- Graph Menus
- These menus allow customization of the graph. See the Graph Menus section for more details.
Graph Menus
- Data
- The Data menu contains toggles for each series relevant to the dive.
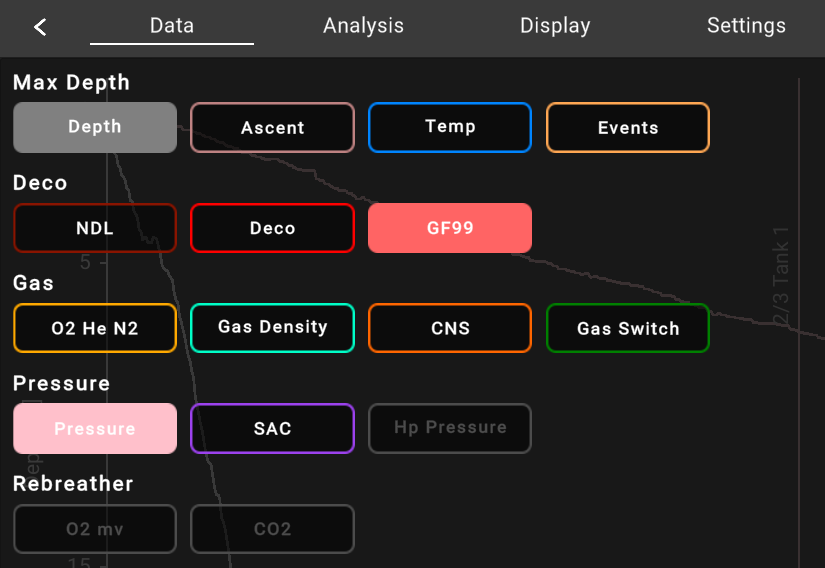
The Data menu
- Analysis
- The Analysis menu contains options for how the dive is analyzed
- Comparison options allow multiple graphs to be compared. See Graph Comparisons later in this article.
- Graph Interaction options switch between providing one Data Panel in Hover, or a range between two points in Drag. See Graph Range later in this article.
- Milestones options enable or disable different time points on the graph, denoted by a vertical line and a label.
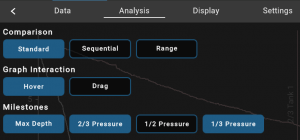
The Analysis menu
- Display
- The Display menu contains options for how tools are positioned and can limit data seen in the Data Panel.
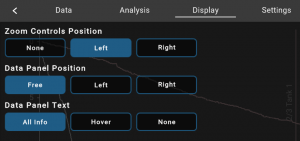
The Display menu
- Settings
- The Settings menu contains options for the display of the graph.
- Graph Grid will overlay a grid onto the graph.
- Clamp Duration will extend the graph further towards the end of a dive.
- Animations enable or disable a quick animation when the graph is loaded. These can be turned off if the Shearwater Cloud application is experiencing slowdowns.
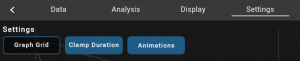
The Settings menu
Graph Range
A new feature in Shearwater Cloud v2.11.0 is a Range option.

Shearwater Cloud Graph with a range selected
This feature allows inspection of one section of a dive. The rightmost Data Panel will provide Maximum and Minimum values of series and the leftmost Data Panel will provide Averages. Note here that only depth is shown Maximum, Minimum, and Averages, because the Pressure (Tank 1) series only descends and the GF99 series is only On-gassing.
To enable this mode, open the Analysis menu and change the Graph Interaction to Drag. Then drag across the graph to create a range. If the range needs to be tweaked, handles are available on the range edges.
Graph Comparisons
The second new feature in Shearwater Cloud v2.11.0 is the ability to compare multiple dives.
To compare multiple dives (currently only available on Shearwater Cloud Desktop) select two or more dives from the Dive List.

Shearwater Cloud Graph displaying two dives selected, with the Standard Comparison option
There are three different options available for comparing multiple dives, which can be selected from the Analysis Graph Menu under the Comparison heading. The following sections will detail each of these options:
Standard
This option allows two graphs to be overlaid on top of each other.
The first dive selected will show up with a solid line, and subsequent dive logs will show up as different dashed lines.
This may be used to compare two similar dives.
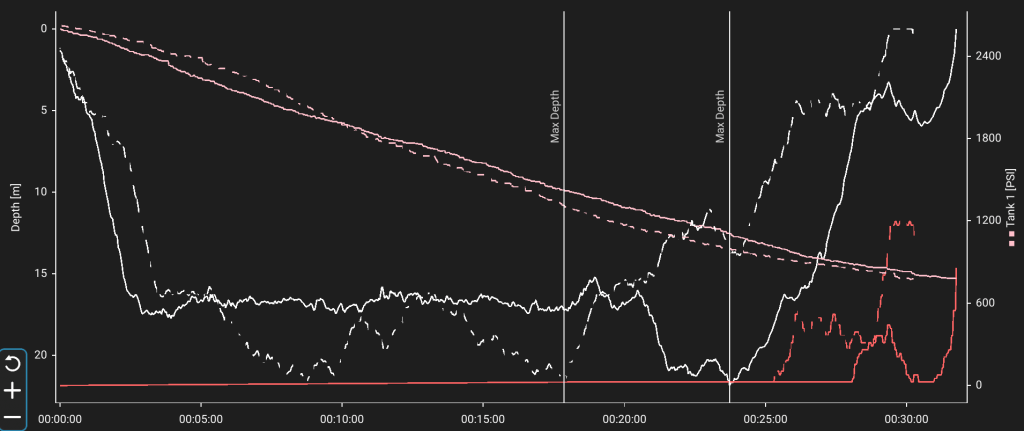
Shearwater Cloud Graph displaying two dives selected, with the Standard Comparison option
Sequential
This option allows for two or more dives to be displayed one after the other.
This may be useful to view a day or a weekend of diving in one place.
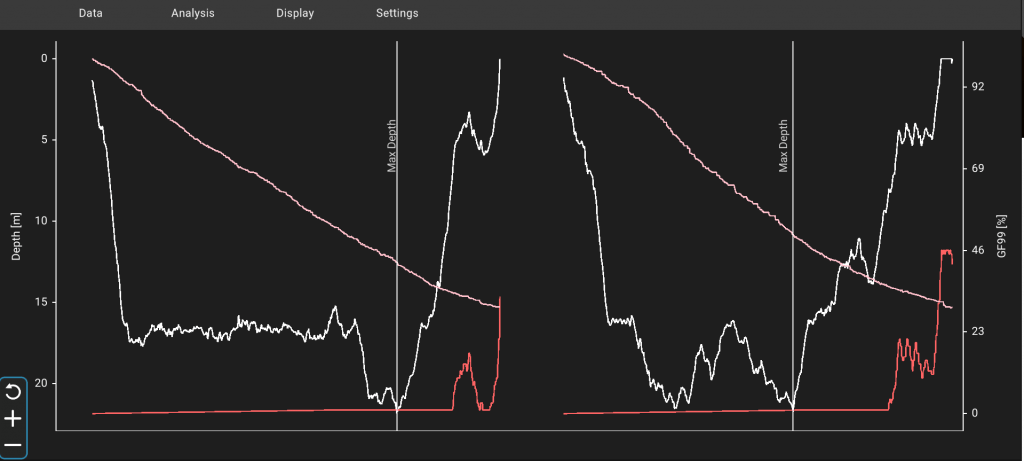
Shearwater Cloud Graph displaying two dives selected with, the Sequential Comparison option
Range
This option allows for two or more dives to be overlaid as maximums and minimums, showing the average of those dives.

Shearwater Cloud Graph displaying two dives selected with, the Range Comparison option
This is useful for comparing two very similar dives.
Note: There is a large amount of data contained in this graph (see image below).
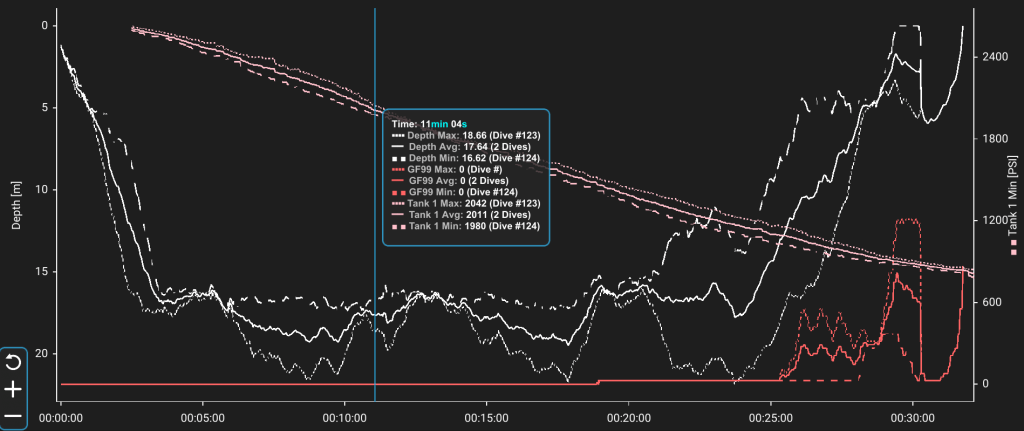
Shearwater Cloud Graph displaying two dives with the Data Panel visible, showing the Maximum, Minimum, and Average values of two dives
Conclusion
Many of the features in this new graph been developed from suggestions made by our Shearwater users. We hope these new additions will help divers gain more insight into their dives.
You can submit your own suggestions and ideas using the Shearwater Cloud Feedback Form.


